Low-Voltage Electrical Devices Visualization
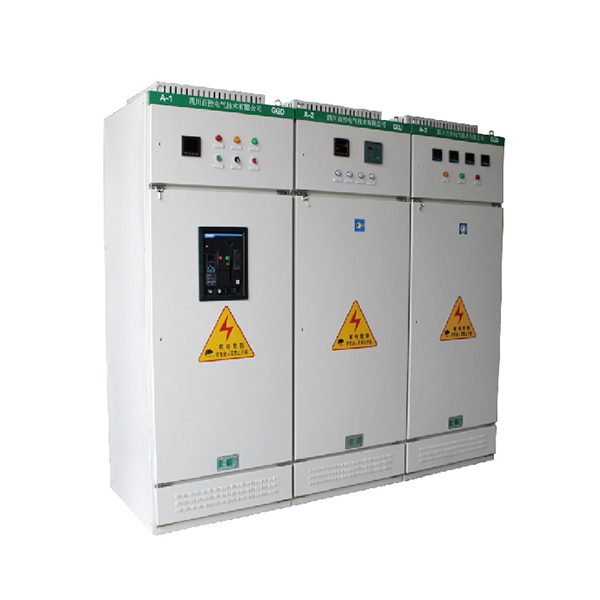
The low-voltage electrical devices visualization system consists of intelligent sensor modules (current/voltage transformers, temperature sensors), edge computing units (data acquisition and preprocessing), industrial communication gateways (supporting MQTT/OPC UA protocols), and cloud/local visualization platforms (web-based + mobile APP). Compatible with low-voltage power distribution equipment such as circuit breakers, contactors, and relays, it adapts to voltage classes of AC 380V and below. Featuring real-time status monitoring (sampling frequency ≥100Hz), power quality analysis (THD ≤5%), fault early warning (response time ≤200ms), and historical data tracing (storage period ≥1 year), it uses sensors to collect real-time operating parameters, completes data cleaning and feature extraction via edge computing, and transmits data to the visualization platform through wired/wireless communication. The platform presents device status via dynamic topology diagrams, trend curves, alarm pop-ups, etc. Widely used in smart building power distribution systems (offices, shopping malls), industrial automation production lines (PLC control cabinet monitoring), new energy charging stations (low-voltage switchgear management), and smart home scenarios, it enables digital operation and maintenance of low-voltage electrical devices, reducing manual inspection costs and enhancing fault prediction capabilities.